
Expert Content. In Your Brand. Updated Daily.
Financial Advisors: no more cobbling together charts and market commentary for clients. Let us do it all for you.
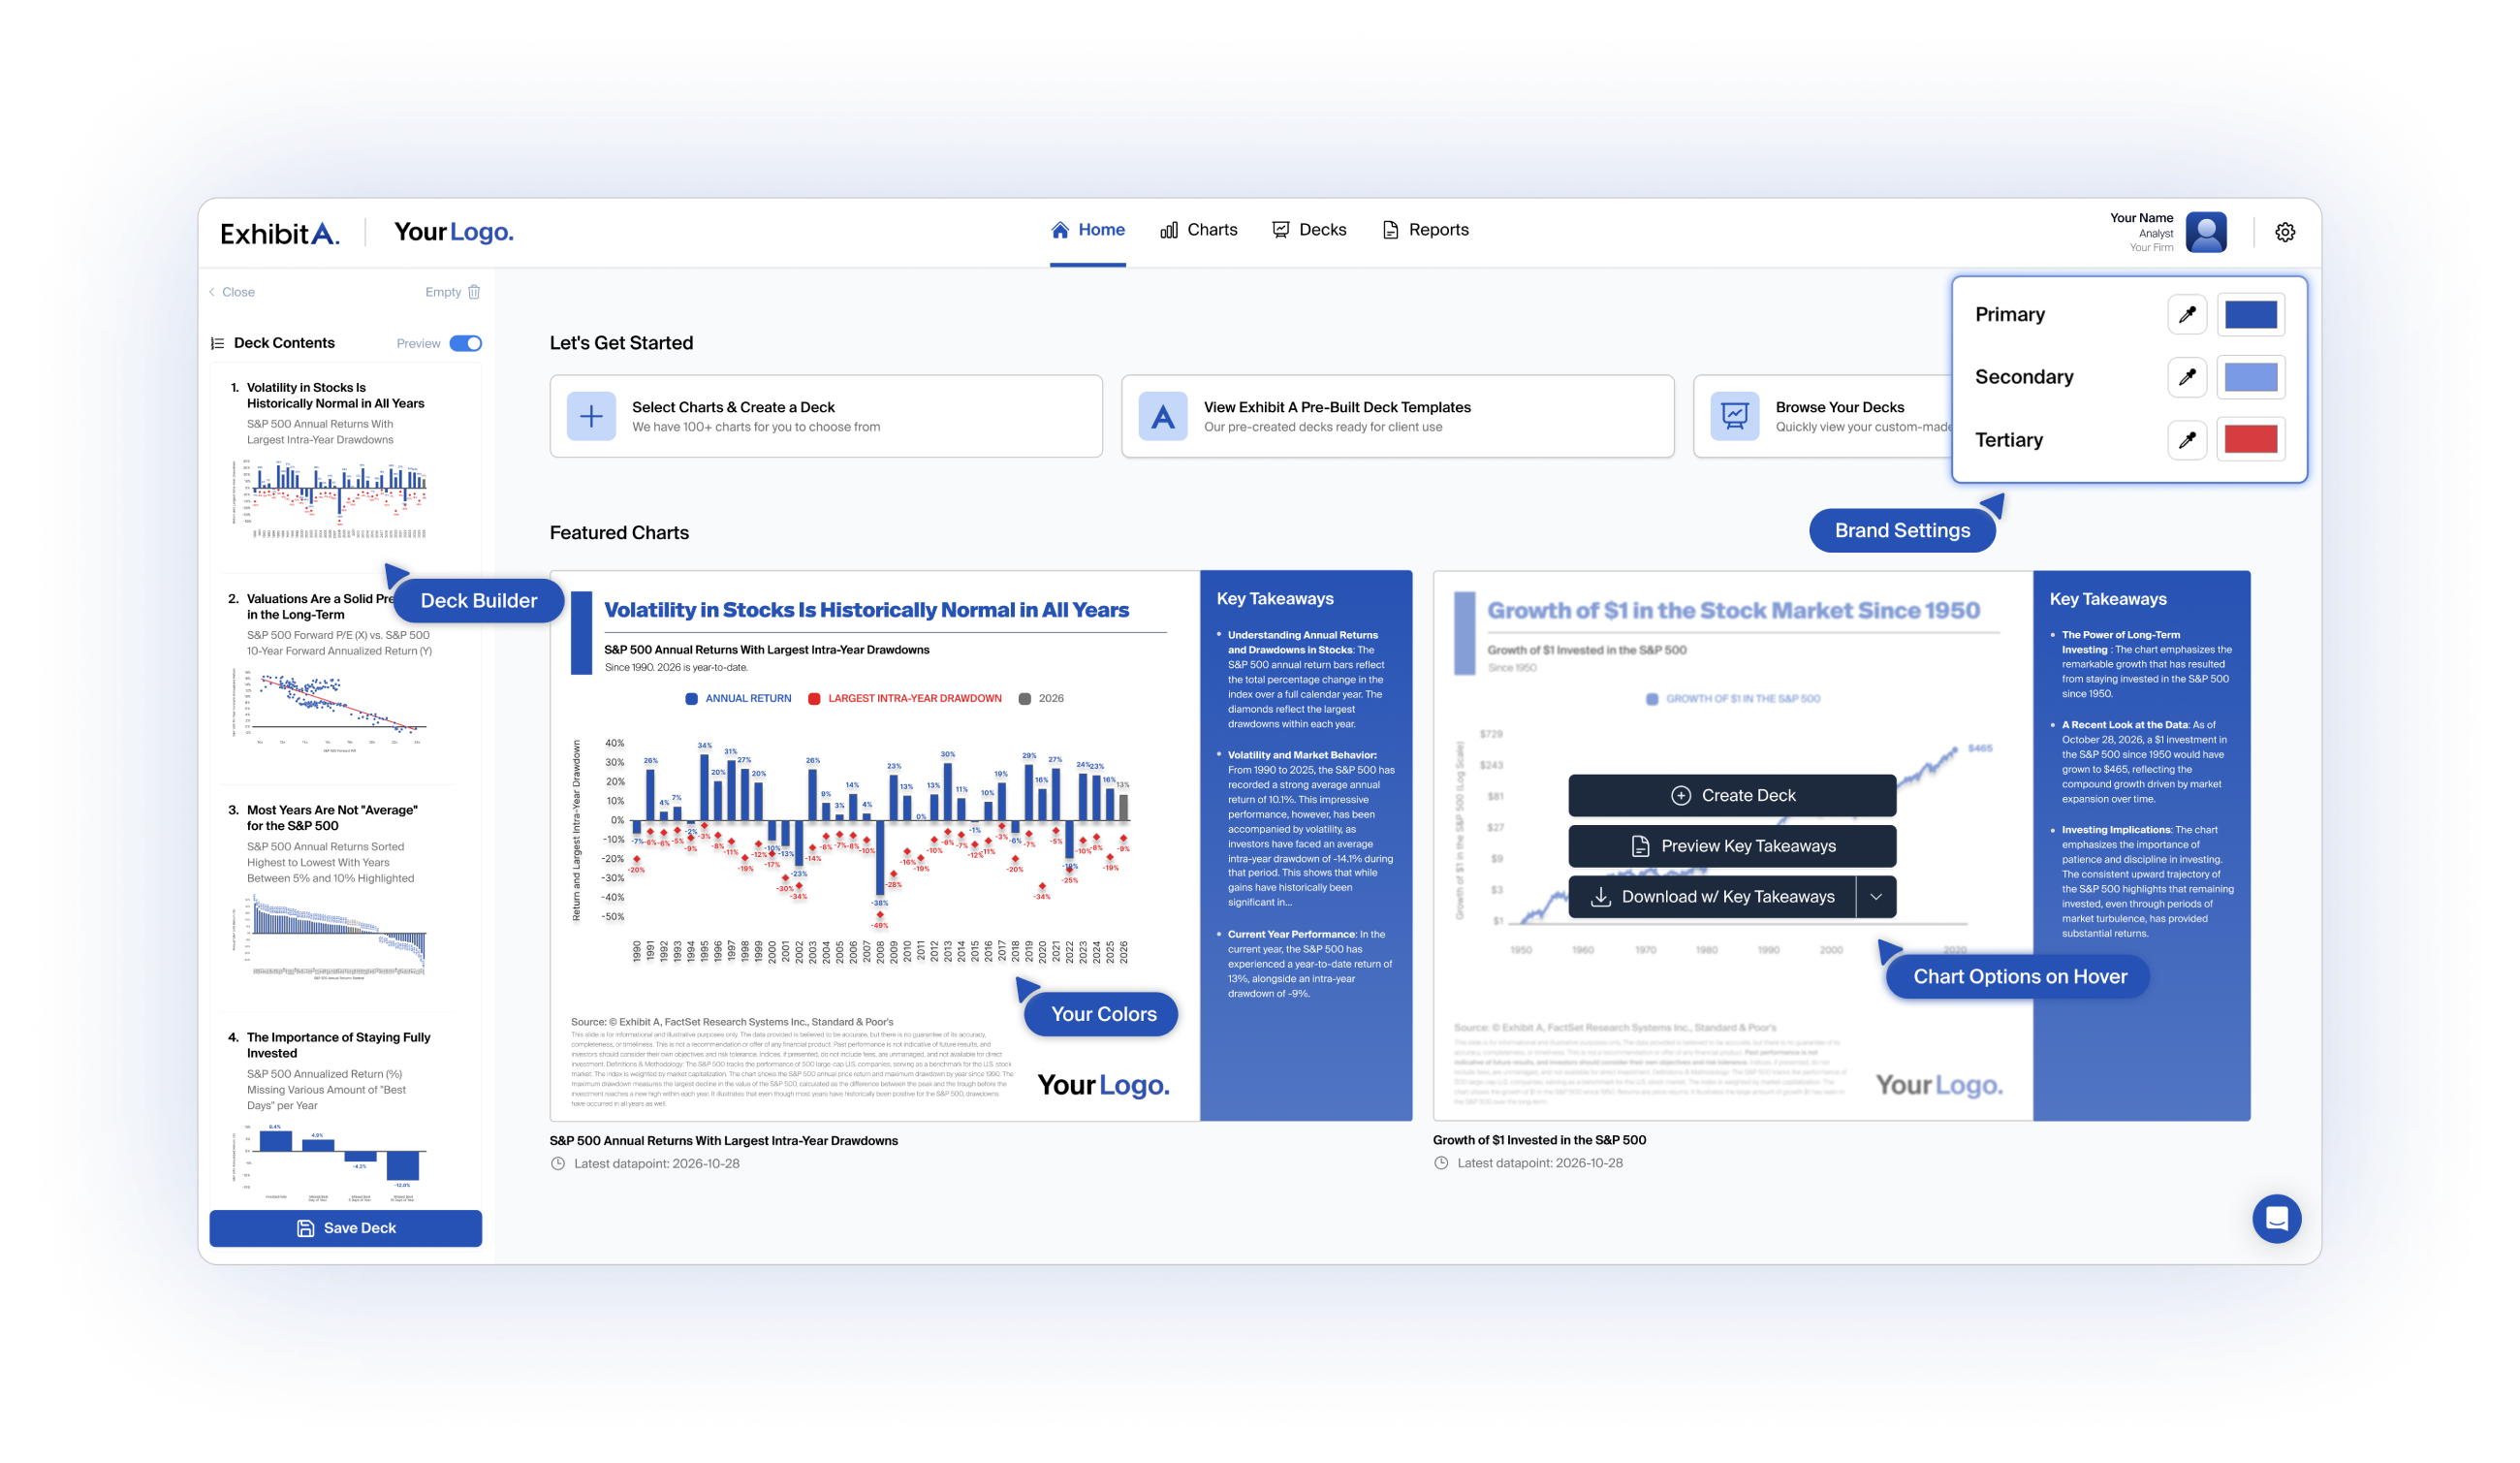

Exhibit A has transformed my ability to post thoughtful and timely content. It has given me the confidence to provide my market thoughts with on-point graphs to back up what is going on. They continue to evolve and improve and are a one of one partner for my practice.


Exhibit A and the team have been a reliable source in painting the picture about markets related to thematic thoughts, historical evidence, market perspectives and long-term investing that have translated to our clients being more informed.


Exhibit A has been a transformative resource for my business. The depth of its content and the quality of its charts have enabled our small RIA to present insights and materials with the sophistication and polish typically associated with much larger institutions. It has helped level the playing field and enhanced the value we deliver to clients.


Exhibit A is hands-down the best investment we make as a business. Matt and his team not only make that signal elegant in charts, they make it relatable for clients and brandable for the firm.


Exhibit A's visual charts are a game-changer for social media, client reviews and prospect meetings. My favorite feature is the monthly market updates with high-quality human insights that clearly isn't generic AI filler.


Capabilities
More Than Just A Logo In The Corner
Your logo, your colors, your face. Plus something timely to send clients every week, with the talking points already written.
Start 7-Day Free TrialPricing
Select A Plan That Works For You
Individual
most popular
$299
/month
For advisors looking for a seat just for themselves.
Individual Plan Features:
Monthly and Quarterly Market and Economic Updates, Ghostwritten by Ben Carlson, CFA
200+ Custom-Branded Charts
NEW: Topical Chart of the Week Every Friday
10+ Custom-Branded Deck Templates
All Charts and Decks Updated Daily
Expert Key Takeaways
Unlimited Custom Deck Creation
Automatically Receive Decks via E-mail
Timely “Chart Blasts” sent to Inbox
PDF and PowerPoint Export
Team of 2-10
50% off every additional seat
$449
/month
For small RIAs or asset managers looking for multiple seats (up to 10).
Includes everything in Individual Plan +
Unique Login for Every Additional Seat
Designated Firm Admin
Branding Uniformity or Custom Branding Per Seat
Enterprise
Let's Talk
For large enterprises looking for a more comprehensive solution.
Reach out:
FAQs
Frequently Asked Questions
What is the story behind Exhibit A?
Exhibit A was built by the world's renowned, content-driven financial advisors who understand the unique challenges of client communication. Drawing from years of experience, we've designed 200+ expertly crafted visuals to address the most pressing market-related questions clients ask on a recurring basis. Our experts include Michael Batnick, CFA, Josh Brown, Ben Carlson, and Matt Cerminaro (aka "Chart Kid Matt"). Our mission is to provide advisors with the tools they need to educate, engage, and empower their clients with clarity and confidence no matter the market environment.
Is there a free trial available?
Yes! Exhibit A offers a 7-day free trial so you can explore the platform and see how it works for your needs. Additionally, you can create a sample on this page before engaging in a trial.
What does the $299 monthly subscription include?
The $299/month subscription includes unlimited access to Exhibit A's chart library, updated daily across four key sections: Investment Principles, Markets, Economics, and Thematics. Our thematic charts are continuously refreshed to address client concerns and provide the most up-to-date insights. It also includes monthly and quarterly market and economic updates ghostwritten by Ben Carlson, CFA, a topical Chart of the Week every Friday, and Chart Blasts when markets move.
Are the charts compliance-friendly?
While the charts are prepared with compliance in mind, it is your responsibility to ensure compliance with your own firm policies and securities regulations prior to use. We allow you to include your own customized disclosures at the end of every deck.
Who is Exhibit A designed for?
Exhibit A is designed for financial advisors and wealth managers who want to elevate their brand, stand out in a competitive market, and deliver value to clients. Whether you're an independent advisor or part of a larger firm, Exhibit A helps you create visually stunning and informative content tailored to your unique audience.
How can Exhibit A's charts benefit my firm and my clients?
Charts are incredibly powerful because people are visual learners. By using well-designed, custom-branded charts, you can clearly communicate complex ideas, making it easier to educate clients on key investment principles. This not only enhances understanding but also positions you as a trusted subject matter expert. In our founders' experience advising clients, utilizing the charts available on the Exhibit A platform has been a game-changer in fostering stronger connections with clients and prospects.
What can I do with the charts from Exhibit A?
You can use Exhibit A charts to create professional client decks, write blog posts, share updates on social media, or enhance your brand's visibility through newsletters. Our charts are designed to drive awareness of your expertise, keep clients focused on their long-term goals, and provide timely insights into markets, economics, investment principles, and thematic trends.
What makes Exhibit A different from other charting platforms?
Exhibit A goes beyond basic charts. We offer a unique custom-branded experience with charts specifically designed to enhance advisor-client communication. We do this by combining our unique wealth-management expertise with visually engaging custom-branded designs to help advisors build their brand, establish trust, and present information in a way that clients and prospects can easily understand and retain.
How often are the charts updated?
Our charts are updated daily to ensure you always have the most current and relevant data at your fingertips. Whether it's new market trends, economic shifts, or evolving thematic insights, Exhibit A keeps your content fresh and aligned with what matters most to your clients.

Meet Your New Team
Every client and prospect deserves a personalized, visual experience from their Financial Advisor. Our team, led by industry experts, is committed to helping you deliver this unique experience.

Michael Batnick, CFA
Chief Executive OfficerManaging Partner at Ritholtz Wealth Management and the driving force behind Exhibit A. Author of The Irrelevant Investor blog and co-host of Animal Spirits and The Compound and Friends podcasts.

Matt Cerminaro
Chief Product OfficerKnown as "Chart Kid Matt," he leads product direction and visual strategy at Exhibit A. He brings deep expertise in data visualization and has built a reputation for turning complex financial data into clear, compelling stories.

Ben Carlson
Contributing AuthorBen Carlson is a contributing author at Exhibit A and one of the most trusted voices in personal finance. He translates markets, investing, and investor behavior into clear insights advisors can use with clients.

Eric Diviney
Chief Technology OfficerEric leads technical direction and architecture at Exhibit A. He brings 10+ years of SaaS & Fortune 500 consulting experience and a deep understanding of building high-performance web applications.

Aram Festekjian
Chief Design OfficerAram leads product experience and creative direction at Exhibit A. With experience across startups, design, SaaS, and fintech, he turns complex ideas into products that feel clear, premium, and built to scale.

Graham Thomas
Chief Revenue OfficerGraham brings 25 years of experience in financial services sales and marketing. He leads go-to-market strategy and partnerships, connecting Exhibit A with advisory firms across the industry.
